Private LoRaWAN Lake Monitoring
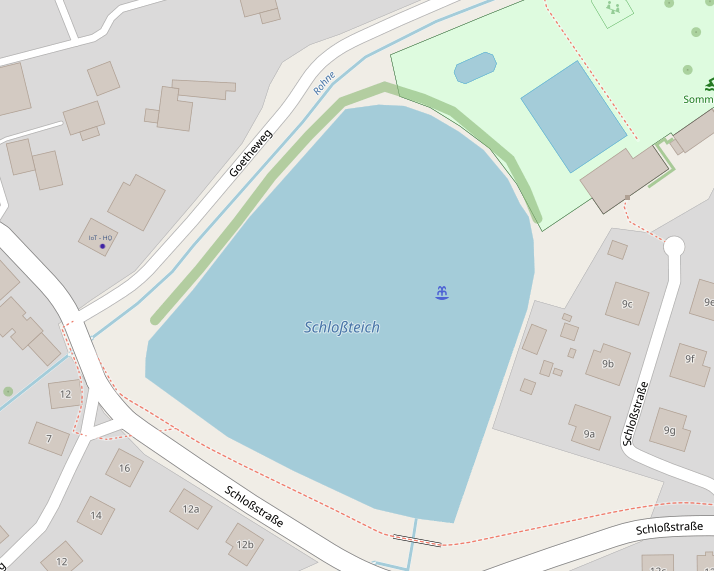
Setup: Fully self-hosted LoRaWAN telemetry system for a 1.1 ha lake. Sensors floating, data flowing, no cloud, no compromise.

Goals
- Measure water temperature and dissolved oxygen (DO)
- Send data via LoRaWAN (~200–300m range)
- Use my Multitech Conduit (MTCDT-LEU1) + (MTAC-LORA-H 8/0 868 MHz) as the gateway (Local)
- Run ChirpStack in Docker on a Mac mini (Local)
- Visualize everything in Grafana on my FreeBSD server (Online)
Architecture
[LoRa Node 1]    [LoRa Node 2]
   (Temp)           (DO)
      \               /
     [LoRaWAN Gateway - MTCDT]
              |
        (Semtech UDP)
              |
      [Mac mini + ChirpStack]
              |
         (MQTT over LAN)
              |
     [FreeBSD + InfluxDB + Grafana]
Hardware
- Gateway: Multitech MTCDT-LEU1 + MTAC-LORA-H 8/0 868 MHz – wired via LAN, LTE as fallback
- Sensors: 2× ELV Make-LW-Set-1 + DS18B20 (Temp) + DFRobot DO Sensor
- Power: 18650 Li-Ion + Solar (5V / TP4056)
- Deployment: Waterproof boxes, mounted on floating platform at lake
Backend Stack
- ChirpStack: Running in Docker on macOS (Mac mini)
- Docker Compose: includes Redis, PostgreSQL, Mosquitto
- Data Out: MQTT publishes to LAN (localhost:1883)
Visualization
- Node-RED or Python script subscribes to MQTT
- Writes parsed payload to InfluxDB
- Grafana dashboard for temperature & DO levels
- Optional: alert if DO < 5 mg/L
Security
- Mosquitto secured with username/password
- Only gateway IP allowed to hit UDP port 1700
- Web UI restricted to local net or VPN
Status
- [x] Gateway installed
- [x] ChirpStack up and running (Docker)
- [x] MQTT data flowing
- [ ] Sensor nodes deployed on lake
- [ ] Payload parsing + Influx writer script
Next Up
- Add pH & turbidity sensors
- LoRa downlink to control node sampling rates
- Battery level monitor
- Public display dashboard with read-only API
TBC